Course Announcements
Due this week:
CL7 due Fri
Take E2
Notes:
No more video quizzes after VQ12
I had mixed up due dates so VQ12 officially now due Wed (but I’m glad if you did it ahead of today’s class as that was my intent)
Will discuss final exam/project in class on Thurs
Scientific Computing#
file paths
importsScientific Computing
File Systems#
When you click through the folders (directories) on your computer, you’re interacting with this hierarchical system.
Absolute vs. Relative Paths#
Absolute Paths#
root specifies the ‘highest’ directory in the file structure (the start).
An absolute file path starts with a slash / specifying the root directory.
Relative Paths#
Modules & Packages#
Modules are stored in Python files (.py). We can import these files into our namespace, to gain access to the module within Python.
In A3 you had to import the package: nltk:
package is a whole bunch of modules
a module stores python (.py) files
when imported, we have access to its functionality
import#
import is a keyword to import external code into the local namespace.
Why do it this way (importing modules)?
Minimize startup costs
Functions in different packages could have the same name - break programs
import example: random module#
import random
# random.sample() documentation
random.sample?
Signature: random.sample(population, k, *, counts=None)
Docstring:
Chooses k unique random elements from a population sequence.

Returns a new list containing elements from the population while
leaving the original population unchanged.  The resulting list is
in selection order so that all sub-slices will also be valid random
samples.  This allows raffle winners (the sample) to be partitioned
into grand prize and second place winners (the subslices).

Members of the population need not be hashable or unique.  If the
population contains repeats, then each occurrence is a possible
selection in the sample.

Repeated elements can be specified one at a time or with the optional
counts parameter.  For example:

    sample(['red', 'blue'], counts=[4, 2], k=5)

is equivalent to:

    sample(['red', 'red', 'red', 'red', 'blue', 'blue'], k=5)

To choose a sample from a range of integers, use range() for the
population argument.  This is especially fast and space efficient
for sampling from a large population:

    sample(range(10000000), 60)
File:      /opt/anaconda3/envs/cogs18/lib/python3.11/random.py
Type:      method
# Random example
to_choose_from = ['1', '2', '3', '4', '5']
number_to_choose = 2

chosen = random.sample(to_choose_from, number_to_choose)

print(chosen)
['3', '5']
random.sample(['a', 'b', 'c'], 1)
['a']
Imports: from & as#
from and as allows us to decide exactly what objects to import into our namespace, and what we call them (in our namespace).
# Import a specific object from a module
from random import choice
## do NOT have to type module name
## using this approach
## to call this
choice(to_choose_from)
'1'
# Import a module with a specific name in our namespace
# used when module names are long
import collections as cols
## collections is not defined
## this code will fail
collections.
# this is how you would do it
cols.
# putting it all together
# Import a specific thing and give it a specific name
from string import punctuation as punc
punctuation
---------------------------------------------------------------------------
NameError                                 Traceback (most recent call last)
Cell In[15], line 1
----> 1 punctuation

NameError: name 'punctuation' is not defined
punc
'!"#$%&\'()*+,-./:;<=>?@[\\]^_`{|}~'
Activity: imports#
Please complete the Google Form: https://forms.gle/zqt9ofiXgczQBKLK6
# If you want to check the imports
# import collections as col
# from statistics import mean as average
# from os import path
# from random import choice, choices
import ascii_letters from string
  Cell In[19], line 6
    import ascii_letters from string
                         ^
SyntaxError: invalid syntax
Scientific Computing#
Scientific Python: Scipy Stack#
Scipy = Scientific Python
scipynumpypandasData Analysis in Python
numpy#
numpy - stands for numerical python
Note:
numpyincludes a new class of an object: the numpy arraythis array has associated attributes
…and methods
External packages must be imported#
import numpy as np
arrays#
arrays - enable work/operations with matrices
Allow you to efficiently operate on arrays (linear algebra, matrix operations, etc.)
# Create some arrays of data
arr1 = np.array([[1, 2], [3, 4]])
arr1
array([[1, 2],
       [3, 4]])
# lists of lists don't store dimensionality well
[[1, 2], [3, 4]]
[[1, 2], [3, 4]]
Arrays: attributes, methods, & indexing#
# Check out an array of data
arr1
array([[1, 2],
       [3, 4]])
attributes#
numpy arrays are an object type…so they have associated attributes (below) and methods (we’ll get to these in a second)!
# Check the shape of the array
arr1.shape
(2, 2)
# Index into a numpy array
print(arr1[0, 0])
1
np.int64(1)
methods#
If you’re looping over an array, there’s probably a method for that…
# sum method
# by default sums all values in array
arr1.sum()
10
# sum method
# has an axis parameter
# axis=0 sums across columns
arr1.sum(axis=0)
array([4, 6])
# typecasting to a different variable type
out_list = arr1.sum(axis=0).tolist()
print(out_list)
type(out_list)
[4, 6]
list
Activity: numpy#
Write code to:
Create a 3x3 array (
my_array) that stores 9 different numbersUse a method to identify the largest value in that array (store it in
array_max)
Include your code in this Google Form: https://forms.gle/27GU7pK2rJGrbLo46
# YOUR CODE HERE
my_array = np.array([[1, 2, 3], [4, 5, 6], [7, 8, 9]])
array_max = my_array.max()
array_max
9
pandas#
Pandas is Python library for managing heterogenous data.
At it’s core, Pandas is built around the DataFrame object, which is:
a data structure for labeled rows and columns of data
associated methods and utilities for working with data.
each column contains a
pandasSeries
import pandas as pd
# Create a dataframe
df = pd.DataFrame({
    'Name': ['Alice', 'Bob', 'Charlie'],
    'Age': [25, 30, 35]
})
# Check out the dataframe
df
| Name | Age | |
|---|---|---|
| 0 | Alice | 25 |
| 1 | Bob | 30 |
| 2 | Charlie | 35 |
# You can index in pandas
# columns store information in series
df['Age']
0    25
1    30
2    35
Name: Age, dtype: int64
# You can index in pandas
# loc specifies row, column position
df.loc[0,:]
Name    Alice
Age        25
Name: 0, dtype: object
# attribute of df object
# row, columns
df.shape
(3, 2)
# how many rows there are in a series/df
df.shape[0] # len(df) would also work
3
len(df)
3
Working with DataFrames#
There are a lot of functions and methods within pandas. The general syntax is df.method() where the method() operates directly on the dataframe df.
# calculate summary statistics
df.describe()
| Age | |
|---|---|
| count | 3.0 |
| mean | 30.0 |
| std | 5.0 |
| min | 25.0 |
| 25% | 27.5 |
| 50% | 30.0 |
| 75% | 32.5 |
| max | 35.0 |
Data in pandas#
pd.read_*()|*is replaced with file type (i.e.read_csv())input to function is path to file or URL
For example…there is a very famous dataset about mammalian sleep. One copy of it is at the URL ‘https://raw.githubusercontent.com/ShanEllis/datasets/master/msleep.csv’
df = pd.read_csv('https://raw.githubusercontent.com/ShanEllis/datasets/master/msleep.csv')
# look at the data
df
| name | genus | vore | order | conservation | sleep_total | sleep_rem | sleep_cycle | awake | brainwt | bodywt | |
|---|---|---|---|---|---|---|---|---|---|---|---|
| 0 | Cheetah | Acinonyx | carni | Carnivora | lc | 12.1 | NaN | NaN | 11.9 | NaN | 50.000 |
| 1 | Owl monkey | Aotus | omni | Primates | NaN | 17.0 | 1.8 | NaN | 7.0 | 0.01550 | 0.480 |
| 2 | Mountain beaver | Aplodontia | herbi | Rodentia | nt | 14.4 | 2.4 | NaN | 9.6 | NaN | 1.350 |
| 3 | Greater short-tailed shrew | Blarina | omni | Soricomorpha | lc | 14.9 | 2.3 | 0.133333 | 9.1 | 0.00029 | 0.019 |
| 4 | Cow | Bos | herbi | Artiodactyla | domesticated | 4.0 | 0.7 | 0.666667 | 20.0 | 0.42300 | 600.000 |
| ... | ... | ... | ... | ... | ... | ... | ... | ... | ... | ... | ... |
| 78 | Tree shrew | Tupaia | omni | Scandentia | NaN | 8.9 | 2.6 | 0.233333 | 15.1 | 0.00250 | 0.104 |
| 79 | Bottle-nosed dolphin | Tursiops | carni | Cetacea | NaN | 5.2 | NaN | NaN | 18.8 | NaN | 173.330 |
| 80 | Genet | Genetta | carni | Carnivora | NaN | 6.3 | 1.3 | NaN | 17.7 | 0.01750 | 2.000 |
| 81 | Arctic fox | Vulpes | carni | Carnivora | NaN | 12.5 | NaN | NaN | 11.5 | 0.04450 | 3.380 |
| 82 | Red fox | Vulpes | carni | Carnivora | NaN | 9.8 | 2.4 | 0.350000 | 14.2 | 0.05040 | 4.230 |
83 rows × 11 columns
…we can access the attributes and execute the methods described above on this dataset:
# rows, columns
df.shape
(83, 11)
df['sleep_total'].median()
10.1
df.describe()
| sleep_total | sleep_rem | sleep_cycle | awake | brainwt | bodywt | |
|---|---|---|---|---|---|---|
| count | 83.000000 | 61.000000 | 32.000000 | 83.000000 | 56.000000 | 83.000000 |
| mean | 10.433735 | 1.875410 | 0.439583 | 13.567470 | 0.281581 | 166.136349 |
| std | 4.450357 | 1.298288 | 0.358680 | 4.452085 | 0.976414 | 786.839732 |
| min | 1.900000 | 0.100000 | 0.116667 | 4.100000 | 0.000140 | 0.005000 |
| 25% | 7.850000 | 0.900000 | 0.183333 | 10.250000 | 0.002900 | 0.174000 |
| 50% | 10.100000 | 1.500000 | 0.333333 | 13.900000 | 0.012400 | 1.670000 |
| 75% | 13.750000 | 2.400000 | 0.579167 | 16.150000 | 0.125500 | 41.750000 |
| max | 19.900000 | 6.600000 | 1.500000 | 22.100000 | 5.712000 | 6654.000000 |
df['order'].value_counts()
order
Rodentia           22
Carnivora          12
Primates           12
Artiodactyla        6
Soricomorpha        5
Perissodactyla      3
Cetacea             3
Hyracoidea          3
Diprotodontia       2
Erinaceomorpha      2
Proboscidea         2
Chiroptera          2
Didelphimorphia     2
Cingulata           2
Lagomorpha          1
Pilosa              1
Monotremata         1
Afrosoricida        1
Scandentia          1
Name: count, dtype: int64
Activity: pandas#
The penguins dataset is a famous dataset provided within the seaborn package. To use it, run the two lines of code below.
Explore the dataset to answer the following questions:
How many different species of penguin are included in this dataset?
What is the average mass of penguins in this dataset?
(Bonus - time permitting) What is the average mass of female penguins in this dataset?
Include your answer on the Google form here: https://forms.gle/H1nPwkhR1QoGDn4i7
import seaborn as sns
df = sns.load_dataset('penguins')
# How many different species of penguin are included in this dataset?
# What is the average mass of penguins in this dataset?
# What is the average mass of female penguins in this dataset
Everything below this is just FYI…not on assignment/lab/exam
Plotting#
%matplotlib inline

import matplotlib.pyplot as plt
df = pd.read_csv('https://raw.githubusercontent.com/ShanEllis/datasets/master/msleep.csv')
# Plot the data
plt.scatter(df['sleep_rem'], df['sleep_cycle']);
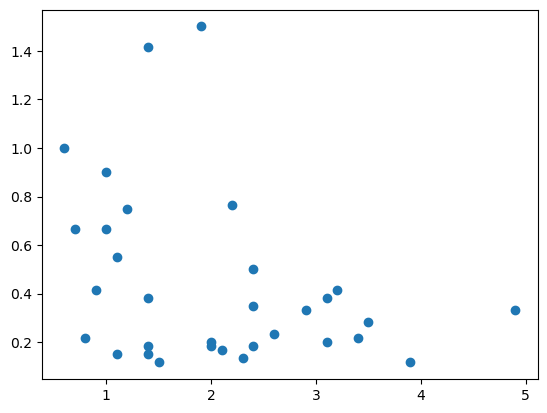
can change plot type
lots of customizations possible
Analysis#
scipy- statistical analysissklearn- machine learning
import scipy as sp
from scipy import stats
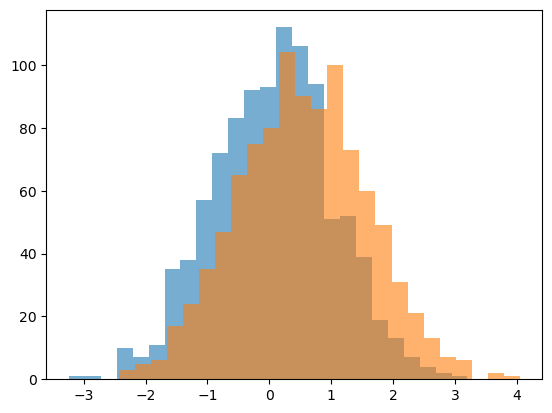
# Simulate some data
d1 = stats.norm.rvs(loc=0, size=1000)
d2 = stats.norm.rvs(loc=0.5, size=1000)
Analysis - Plotting the Data#
# Plot the data
plt.hist(d1, 25, alpha=0.6);
plt.hist(d2, 25, alpha=0.6);
Analysis - Statistical Comparisons#
# Statistically compare the two distributions
stats.ttest_ind(d1, d2)
TtestResult(statistic=-10.317692476019195, pvalue=2.366035526414714e-24, df=1998.0)