Scientific Computing#
![]()
[ad] Food Insecurity Survey

Q&A
Q: Are we getting command lines in the final exam?
A: You will need to know the shell commands and absolute/relative paths for both E2 and the final.
Q: How do you know when to use a script or a module?
A: If you are writing the code, you consider the task. Do you want to store code to import elsewhere? Module. Or do you want to write some code that you want to run from top to bottom? Script!
Q: How heavily will we be tested on our knowledge of a script and module? What type of questions can we expect?
A: For E2, just know the similarities and difference. For the final, we’ll be creating them…but we’ll have mroe practice before then.
Q: I was wondering what the difference is going to be between E2 and the final? Is it just going to be similar to the first two midterms and cover more information or will it be more challenging, us attempting to create code like we do in assignments, etc.
A: E2 focuses on material from loops-clases. Final exam focuses on material after classes, culminating in a mini-project. We’ll discuss details soon in class!
Q: I’m still a little unsure about when to use self and how it works inside methods.
A: We’ll discuss this more today - ask questions if still not clear, if you’re comfortable!
Q: Also, how do I know when to use a class vs. just writing functions?
A: Well, typically, I’ll tell you. But, when you have to decide on your own…if you want to keep attributes and methods organized together and use attributes across different methods, class. If not, just a function.
Q: How many points could we have so far? How many remain?
A: See below
Current possible points earned: 61
pre-course: 2
VQ1-12 : 12
CL1-6: 12
A1-4: 20
Oral exam: 2.5
E1: 12.5
Remaining points to earn: 39
post-course: 2
CL7-8: 4
A5: 5
Oral exam 2: 2.5
E2: 12.5
Final exam: 13
Course Announcements
Due this week:
CL7 due Fri
Take E2: 5/23-5/30
Notes:
Reminder to sign up for Oral exam 2 slot (link also on Canvas homepage)
If you have a few minutes, please complete the Food Insecurity Survey before 5/26 <- there’s an optional quiz on Canvas with the link too
Re-take of E1 or E2
sign-ups will be available Fri 5/30 (so students have info they need to decide if they want to retake
replacement grade: 75% of highest + 25% of lowest
Q&A
Q: Can we go over F strings again?
A: Yup an f string allows you to include a variable within a string using {}. So if you hadvar_6 = 6…..you could include that value in an f string as follows:f"I like the number {var_6}."Note that you do not have to convert the int to a string…and spacing is indicated within the string directly.
Q: How do you know whether to include a ‘()’ after a class definition (i.e. class Exam2() or class Exam2)?
A: When creating a class, the parentheses are optional. When creating an instance of a class, you always need parentheses.
Q: how ethical do you think chatgpt is
A: Love this question. I think ChatGPT (and other LLMs) have serious ethical (and climate) concerns. Specifically, ChatGPT has been built, in many cases…although it’s not entirely clear the extent to which this is true, on copyright material. So the model has learned from material that wasn’t its to learn from. Beyond that, humans have made decisions as to how ChatGPT is to respond. Same for other LLMs (you’ll notice that Claude is more empathetic, but also more resistant to making decisions for prompters). This is not without its ethical implications. Further, the carbon footprint for training these models is quite large. So, as a society, we have to do a cost-benefit analysis…and also regulate in meaningful ways, neither of which we’ve done well yet. Those are just the thoughts of the top of my head! Happy to discuss this further!
Q: How to read a question and understand what it wants me to execute
A: Look back to the methods notes and the e2 review when I discussed the responses as we discussed this in a bit more detail! But, briefly here, you want to break the question down into smaller steps. To do this, you have to 1) figure out what the question is asking and then 2) figure out how you could use code to do this. Often students struggle to bridge those two steps. In that case, I encourage students to take a step back and figure out how their brains would do the task….did you need to look at each value over a list of numbers and add them up….if yes, then you need a loop! Did you have to use conditional logic? If yes, then you need anif
Q: i know when to USE self, but when it comes to the def method (self) im confused on why we JUST use self
A: If you’re only using self, that indicates you don’t want/need any additional inputs from the user. Within a class, this typically means you’re going to only operate on existing attributes.
Q: If you were not to use the += or -= what would you code instead?
A: If the code weremy_variable += 6, this is shorthand formy_variable = my_variable + 6
Q: Will we have to be able to use read_* for any of our exams or assignments?
A: Yes, for A5 and the final
Course Announcements
Due this week:
CL8 due Fri
A5 due Sun
Complete E2
Reminder to complete the Food Insecurity Survey (by Friday)
The Zen of Python#
import this
The Zen of Python, by Tim Peters

Beautiful is better than ugly.
Explicit is better than implicit.
Simple is better than complex.
Complex is better than complicated.
Flat is better than nested.
Sparse is better than dense.
Readability counts.
Special cases aren't special enough to break the rules.
Although practicality beats purity.
Errors should never pass silently.
Unless explicitly silenced.
In the face of ambiguity, refuse the temptation to guess.
There should be one-- and preferably only one --obvious way to do it.
Although that way may not be obvious at first unless you're Dutch.
Now is better than never.
Although never is often better than *right* now.
If the implementation is hard to explain, it's a bad idea.
If the implementation is easy to explain, it may be a good idea.
Namespaces are one honking great idea -- let's do more of those!
Scientific Computing#
Scientific Python: Scipy Stack#
Scipy = Scientific Python
scipynumpypandasData Analysis in Python
numpy#
numpy - stands for numerical python
Note:
numpyincludes a new class of an object: the numpy arraythis array has associated attributes
…and methods
External packages must be imported#
import numpy as np
arrays#
arrays - enable work/operations with matrices
Allow you to efficiently operate on arrays (linear algebra, matrix operations, etc.)
# Create some arrays of data
arr1 = np.array([[1, 2], [3, 4]])
arr1
array([[1, 2],
       [3, 4]])
# lists of lists don't store dimensionality well
[[1, 2], [3, 4]]
[[1, 2], [3, 4]]
Arrays: attributes, methods, & indexing#
# Check out an array of data
arr1
array([[1, 2],
       [3, 4]])
attributes#
numpy arrays are an object type…so they have associated attributes (below) and methods (we’ll get to these in a second)!
# Check the shape of the array
arr1.shape
(2, 2)
# Index into a numpy array
arr1[0, 0]
1
methods#
If you’re looping over an array, there’s probably a method for that…
# sum method
# by default sums all values in array
arr1.sum()
10
# sum method
# has an axis parameter
# axis=0 sums across columns
arr1.sum(axis=0)
array([4, 6])
# typecasting to a different variable type
out_list = arr1.sum(axis=0).tolist()
print(out_list)
type(out_list)
[4, 6]
list
Activity: numpy#
Write code to:
Create a 3x3 array (
my_array) that stores 9 different numbersUse a method to identify the largest value in that array (store it in
array_max)
Include your code in this Google Form: https://forms.gle/r87f4dpoNpu9wB5o7
# YOUR CODE HERE
my_array = np.array([[1,2,3], [4,523983249782398,6], [7,8,9]])
array_max = my_array.max()
pandas#
Pandas is Python library for managing heterogenous data.
At it’s core, Pandas is built around the DataFrame object, which is:
a data structure for labeled rows and columns of data
associated methods and utilities for working with data.
each column contains a
pandasSeries
import pandas as pd
# Create a dataframe
df = pd.DataFrame({
    'Name': ['Alice', 'Bob', 'Charlie'],
    'Age': [25, 30, 35]
})
# Check out the dataframe
df
| Name | Age | |
|---|---|---|
| 0 | Alice | 25 |
| 1 | Bob | 30 |
| 2 | Charlie | 35 |
# You can index in pandas
# columns store information in series
df['Age']
0    25
1    30
2    35
Name: Age, dtype: int64
# You can index in pandas
# loc specifies row, column position
df.loc[0,:]
Name    Alice
Age        25
Name: 0, dtype: object
# attribute of df object
# row, columns
df.shape
(3, 2)
# how many rows there are in a series/df
df.shape[0] # len(df) would also work
3
len(df)
3
Working with DataFrames#
There are a lot of functions and methods within pandas. The general syntax is df.method() where the method() operates directly on the dataframe df.
# calculate summary statistics
df.describe()
| Age | |
|---|---|
| count | 3.0 |
| mean | 30.0 |
| std | 5.0 |
| min | 25.0 |
| 25% | 27.5 |
| 50% | 30.0 |
| 75% | 32.5 |
| max | 35.0 |
Data in pandas#
pd.read_*()|*is replaced with file type (i.e.read_csv())input to function is path to file or URL
For example…there is a very famous dataset about mammalian sleep. One copy of it is at the URL ‘https://raw.githubusercontent.com/ShanEllis/datasets/master/msleep.csv’
df = pd.read_csv('https://raw.githubusercontent.com/ShanEllis/datasets/master/msleep.csv')
# look at the data
df
| name | genus | vore | order | conservation | sleep_total | sleep_rem | sleep_cycle | awake | brainwt | bodywt | |
|---|---|---|---|---|---|---|---|---|---|---|---|
| 0 | Cheetah | Acinonyx | carni | Carnivora | lc | 12.1 | NaN | NaN | 11.9 | NaN | 50.000 |
| 1 | Owl monkey | Aotus | omni | Primates | NaN | 17.0 | 1.8 | NaN | 7.0 | 0.01550 | 0.480 |
| 2 | Mountain beaver | Aplodontia | herbi | Rodentia | nt | 14.4 | 2.4 | NaN | 9.6 | NaN | 1.350 |
| 3 | Greater short-tailed shrew | Blarina | omni | Soricomorpha | lc | 14.9 | 2.3 | 0.133333 | 9.1 | 0.00029 | 0.019 |
| 4 | Cow | Bos | herbi | Artiodactyla | domesticated | 4.0 | 0.7 | 0.666667 | 20.0 | 0.42300 | 600.000 |
| ... | ... | ... | ... | ... | ... | ... | ... | ... | ... | ... | ... |
| 78 | Tree shrew | Tupaia | omni | Scandentia | NaN | 8.9 | 2.6 | 0.233333 | 15.1 | 0.00250 | 0.104 |
| 79 | Bottle-nosed dolphin | Tursiops | carni | Cetacea | NaN | 5.2 | NaN | NaN | 18.8 | NaN | 173.330 |
| 80 | Genet | Genetta | carni | Carnivora | NaN | 6.3 | 1.3 | NaN | 17.7 | 0.01750 | 2.000 |
| 81 | Arctic fox | Vulpes | carni | Carnivora | NaN | 12.5 | NaN | NaN | 11.5 | 0.04450 | 3.380 |
| 82 | Red fox | Vulpes | carni | Carnivora | NaN | 9.8 | 2.4 | 0.350000 | 14.2 | 0.05040 | 4.230 |
83 rows × 11 columns
…we can access the attributes and execute the methods described above on this dataset:
# rows, columns
df.shape
(83, 11)
df.describe()
| sleep_total | sleep_rem | sleep_cycle | awake | brainwt | bodywt | |
|---|---|---|---|---|---|---|
| count | 83.000000 | 61.000000 | 32.000000 | 83.000000 | 56.000000 | 83.000000 |
| mean | 10.433735 | 1.875410 | 0.439583 | 13.567470 | 0.281581 | 166.136349 |
| std | 4.450357 | 1.298288 | 0.358680 | 4.452085 | 0.976414 | 786.839732 |
| min | 1.900000 | 0.100000 | 0.116667 | 4.100000 | 0.000140 | 0.005000 |
| 25% | 7.850000 | 0.900000 | 0.183333 | 10.250000 | 0.002900 | 0.174000 |
| 50% | 10.100000 | 1.500000 | 0.333333 | 13.900000 | 0.012400 | 1.670000 |
| 75% | 13.750000 | 2.400000 | 0.579167 | 16.150000 | 0.125500 | 41.750000 |
| max | 19.900000 | 6.600000 | 1.500000 | 22.100000 | 5.712000 | 6654.000000 |
df['order'].value_counts()
order
Rodentia           22
Carnivora          12
Primates           12
Artiodactyla        6
Soricomorpha        5
Perissodactyla      3
Cetacea             3
Hyracoidea          3
Diprotodontia       2
Erinaceomorpha      2
Proboscidea         2
Chiroptera          2
Didelphimorphia     2
Cingulata           2
Lagomorpha          1
Pilosa              1
Monotremata         1
Afrosoricida        1
Scandentia          1
Name: count, dtype: int64
Activity: pandas#
The penguins dataset is a famous dataset provided within the seaborn package. To use it, run the two lines of code below.
Explore the dataset to answer the following questions:
How many different species of penguin are included in this dataset?
What is the average mass of penguins in this dataset?
(Bonus - time permitting) What is the average mass of female penguins in this dataset?
Include your answer on the Google form here: https://forms.gle/PrdnFP45bwX2JkHj9
import seaborn as sns
df = sns.load_dataset('penguins')
df
| species | island | bill_length_mm | bill_depth_mm | flipper_length_mm | body_mass_g | sex | |
|---|---|---|---|---|---|---|---|
| 0 | Adelie | Torgersen | 39.1 | 18.7 | 181.0 | 3750.0 | Male |
| 1 | Adelie | Torgersen | 39.5 | 17.4 | 186.0 | 3800.0 | Female |
| 2 | Adelie | Torgersen | 40.3 | 18.0 | 195.0 | 3250.0 | Female |
| 3 | Adelie | Torgersen | NaN | NaN | NaN | NaN | NaN |
| 4 | Adelie | Torgersen | 36.7 | 19.3 | 193.0 | 3450.0 | Female |
| ... | ... | ... | ... | ... | ... | ... | ... |
| 339 | Gentoo | Biscoe | NaN | NaN | NaN | NaN | NaN |
| 340 | Gentoo | Biscoe | 46.8 | 14.3 | 215.0 | 4850.0 | Female |
| 341 | Gentoo | Biscoe | 50.4 | 15.7 | 222.0 | 5750.0 | Male |
| 342 | Gentoo | Biscoe | 45.2 | 14.8 | 212.0 | 5200.0 | Female |
| 343 | Gentoo | Biscoe | 49.9 | 16.1 | 213.0 | 5400.0 | Male |
344 rows × 7 columns
# How many different species of penguin are included in this dataset?
df['species'].value_counts()
df['species'].nunique()
df['species'].unique()
array(['Adelie', 'Chinstrap', 'Gentoo'], dtype=object)
# What is the average mass of penguins in this dataset?
df.describe()
df['body_mass_g'].mean()
4201.754385964912
# What is the average mass of female penguins in this dataset

# filter to only include the female penguins -> calculcated the mean
df[df['sex'] == 'Female']['body_mass_g'].mean()

# group by sex -> calculated mean
df.groupby('sex')['body_mass_g'].mean()
sex
Female    3862.272727
Male      4545.684524
Name: body_mass_g, dtype: float64
Everything below this is just FYI…not on assignment/lab/exam
Plotting#
%matplotlib inline

import matplotlib.pyplot as plt
df = pd.read_csv('https://raw.githubusercontent.com/ShanEllis/datasets/master/msleep.csv')
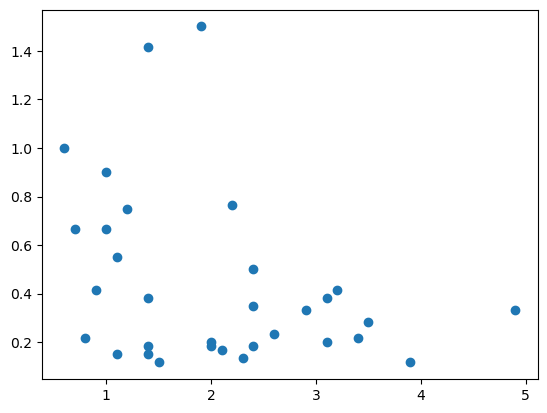
# Plot the data
plt.scatter(df['sleep_rem'], df['sleep_cycle']);
can change plot type
lots of customizations possible
Analysis#
scipy- statistical analysissklearn- machine learning
import scipy as sp
from scipy import stats
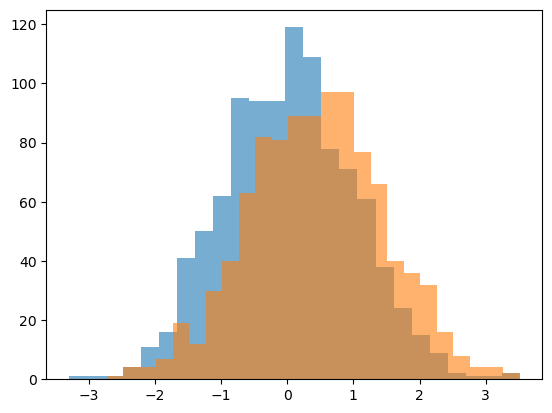
# Simulate some data
d1 = stats.norm.rvs(loc=0, size=1000)
d2 = stats.norm.rvs(loc=0.5, size=1000)
Analysis - Plotting the Data#
# Plot the data
plt.hist(d1, 25, alpha=0.6);
plt.hist(d2, 25, alpha=0.6);
Analysis - Statistical Comparisons#
# Statistically compare the two distributions
stats.ttest_ind(d1, d2)
TtestResult(statistic=-9.249173637189667, pvalue=5.627311200756971e-20, df=1998.0)